


Let’s measure up Google Analytics 4 vs Universal Analytics. Understanding how your Google Analytics data tells a story and echoes what is happening is key to turning your insights into action for your business.
For this data to paint a complete and holistic picture, asking the right questions, collecting meaningful data and understanding the use of key metrics is crucial.
We know that not getting lost in the sea of data may seem like an art form, and switching from Universal Analytics to GA4 might feel like learning to ride a bike again.
So, to help you transition to GA4, we’ve analysed the seven most important metrics and whether or not you can compare them against those in your Universal Analytics property. Here’s the lowdown on Google Analytics 4 vs Universal Analytics.
Metrics that matter
Not all metrics are created equal. Here are the key points to look out for in Google Analytics 4.
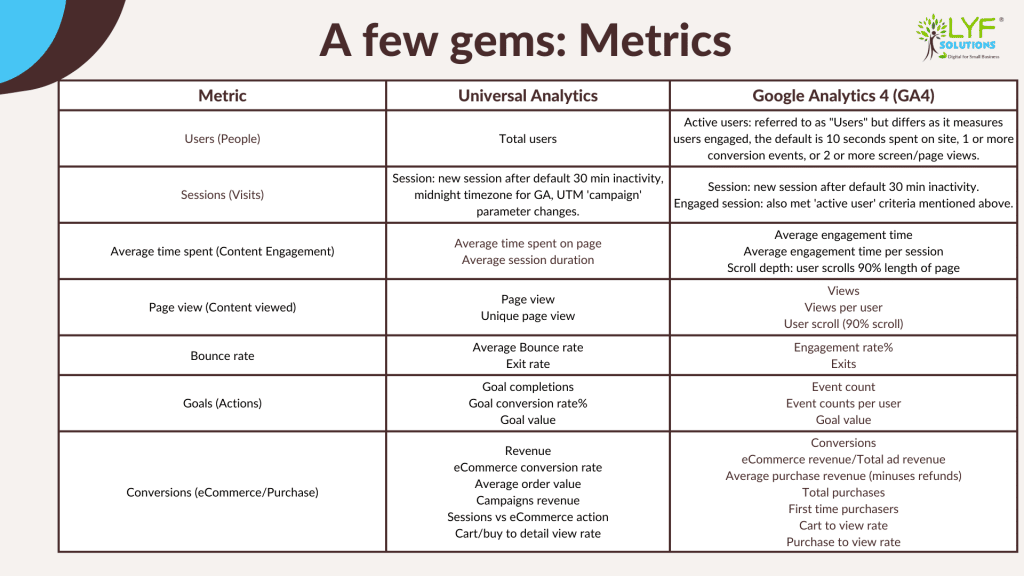
Users
For starters, there are now 3 User metrics in GA4: Total Users, Active Users and New Users.
The Primary User metric has also switched from Total Users in UA to Active Users in GA4.
Google defines Active Users as:
“Number of distinct users who visited your website or application. An active user is any user who has an engaged session (10 seconds or more) or when Analytics collects:
- the first_visit event or engagement_time_msec parameter from a website
- the first_open event or engagement_time_msec parameter from an Android app
- the first_open or user_engagement event from an iOS app.
This is about making sure users are those who interact with your website and or app content.
Note that engagement is measured by both automatic and custom events. Unless you’ve turned them off, events such as a YouTube video view, 90% page scrolls of your content, outbound link clicks and file downloads are all parts of this.
Sessions
There are a couple of changes that may affect your reporting of sessions. Here are the differences in more detail:
Universal Analytics session metric:
- Defined as the period a user is actively engaged with your app or your website – ends after a default 30 minutes of inactivity
- A new session will begin after midnight, a time-out (default setting: 30 mins or more of inactivity) and changing campaign parameters when using the Urchin-Tracking Module (UTM) URL builder.
Google Analytics 4 session metric:
- The session-start event generates a session ID. This is to determine the event that each session comes from. In GA4, this session ID will be connected with each subsequent event in the session.
- As with UA, a session is terminated after 30 minutes of inactivity, and a new session will begin after such a time-out.
- However, sessions are not restarted with new campaign parameters or at midnight.
Good to know:
- Geography and timezones may influence reporting on this metric; this is especially relevant to companies with global reach, where users may be active across that midnight threshold.
- Although GA4 Properties uses a statistical estimate, unique session IDs allow it to count sessions with far higher accuracy and low error rate.
Content Engagement

Content engagement is a powerful way to understand the user experience of your website or app and ensure that your content is meeting user expectations.
You can use it to analyse a user journey and help you evaluate what works well and where changes to your online content are needed.
The metric you are after in GA4 is the average engagement time.
It’s the sum of user engagement duration per active user. In GA4, that gives you the average time per session rather than UA’s average time spent on a page.
Good to know: We recommend you look at this metric within varying timeframes, as the average engagement time can differ significantly depending on your type of business and the content you’ve created.
Typically in Universal Analytics, a 700-word blog post received 2 to 3 minutes on average time spent for comparison purposes.
Pageviews
Pageviews is another valuable metric to help you analyse how your webpage is performing. It can also give you the data needed to work on an SEO strategy and to track how changes impact user behaviour over time.
According to Google support, pageviews data should be reasonably close between UA and GA4. However, that depends somewhat on whether you have set up filters for this metric.
Here are the differences in measurement between GA4 and UA in more detail:
Universal Analytics Pageviews metric
In UA, Pageviews refers to the total number of pages viewed, including repeated views of a single page. This contrasts with Unique Pageview, where the number of pages viewed is totalled, but the duplicates are not included.
Google Analytics 4 Pageview metric
The main difference is that GA4 no longer has a Unique Page view metric.
With the elimination of Unique Pageviews, this is now simply the Views metric. It combines page- and screen views and gives you the total number of web pages and/or app screens your users saw, including repeated views.
However, you have the new ‘Scrolls’ metric you can use to determine how often someone scrolls 90% of the page content. This will help you understand how much of your content users consume.
Bounce Rate
Comparing UA and GA4, you can look at the Bounce rate as the inverse of the new Engagement rate in GA4. The Engaged rate (calculated by dividing the Engaged Sessions by Sessions) is a far more efficient measurement of a user’s true interaction with a webpage.
To recap, an engaged session in GA4 is defined as the number of sessions that lasted 10 seconds or more, had a conversion event or at least 2 page- or screen views.
For a detailed outline and a couple of good examples of the difference in outcome between bounced and engaged sessions, it’s worth heading over to the Analytics help pages.
Note: Google has since announced the return of ‘bounce rate’ in Google Analytics 4. However, it is the definiton of Non Engaged Sessions. Meaning, that ‘bounce rate’ technically has not returned, just the name itself. Confusing? Yes!
Goals (Actions)
The revamp of UAs Goals is one of the major changes in GA4. They are now called Events.
Goals in Universal Analytics – measuring your target objectives
Universal Analytics’s Goal represents a completed activity (a conversion).
The definition of Goal Completion is the total number of completions for all goals defined in the profile. However, the goal conversion rate shows you the percentage of sessions resulting in a conversion relating to at least one of the goals defined in the profile.
A UA goal value represents the monetary amount you have assigned to a specific goal, a conversion. Google again has provided a good outline and examples of the use of goal values here.
Events in GA4 – measuring user interactions
Events in GA4 allow you to measure distinct user interactions across your website and app.
The Event Count is an automatically populated metric and refers to the number of times users trigger an event. The metric Event Count per User is also automatically populated and refers to the average number of events that are triggered per single user.
Event Value represents the sum of all value parameters per event. When populating this metric, make sure to include the value parameter.
Conversion (eCommerce/Purchase) metric
Conversion data will give you invaluable insights into your business’ sales and lead performance.
For example, it allows you to track and analyse the key actions of your users, the level of user engagement, the effectiveness of your comms and marketing campaigns, and your web page’s user experience.
Conversion data relating to eCommerce or product purchases will allow you to gather information about your users’ shopping behaviour. It can also quantify your most popular services or products and track the impact of specific product placements or promotions on your business’ revenue.
Your reports will allow you to access metrics such as:
- the number of times users added an item(s) to their shopping cart,
- the number of users who added a product you sell to their shopping cart per user who viewed the item
- The number of times an item list was viewed
- The total number of purchases on your app or website
For the complete list of conversion metrics, go to Analytics help – Dimensions and Metrics
The main difference between Universal Analytics and Google Analytics 4 is that “UA only counts one conversion per session for the same goal. GA4 counts multiple conversions per session for the same conversion event” (Google support).
Metrics matter
The ability to set and track metrics and collect data that is meaningful is an invaluable skill.
Collected data will allow you to analyse where your business is headed, underpin key strategies, and track long-term trends and initiatives.
To do all that without getting lost in an ocean of dimensions, metrics and collected information can be a tall order.
Before you feel overwhelmed with all the technicalities of the GA4 setup and its reporting functions, get in touch with us. We are here to help!