

What is Google Analytics?
In a nutshell, Google Analytics is a web analytics app that helps you analyse your website traffic. The data and insight that you gain from Google Analytics reports can then be used to improve your website performance and user experience, among other things.
There are many reasons why more than 50 million websites around the world use Google Analytics. One reason is the fact that it’s free. While Google does offer Analytics 360, a powerful paid web analytics tool, the truth is that the free Google Analytics is a great offering for most site owners to be able to measure their website performance.
Google Analytics reports can be used to improve your website in many ways: to help visitors stay on your website, to create the right type of content on your website, and even to see if your digital marketing efforts are working. The platform can be complicated at times, and we will do our best to avoid the lingo and put it in simple terms for you.
What types of data can Google Analytics provide?
Google Analytics works by requiring you to put a tracking code into the code for your website, which will then record various activities of your website visitors. The code then sends all the information back to the Google Analytics server once each visitor leaves your website.
The user side menu
This menu may change from time to time but is your resource to find different types of data in the tool.
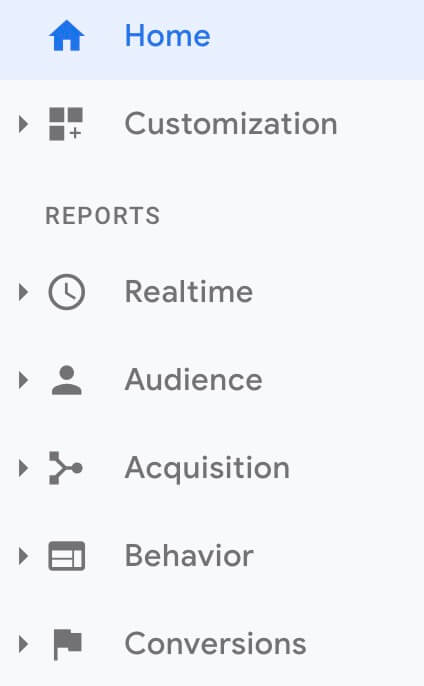
- Home: A default dashboard of the last 7 days of site performance.
- Customization: Where you can make customised reports for your data.
- Realtime: See who is on your site now and what they are doing.
- Audience: Deep dive into who is visiting your website, demographics, device type, and their interests.
- Acquisition: Find out where they are coming from. Is it organic search, social media or elsewhere?
- Behaviour: Identify what content they are reading, what they don’t spend time on, the speed of the site and internal searches.
- Conversions: Review your setup goals and eCommerce transaction data to see what, when and how users are converting on your website.
Secondary menu (further down)
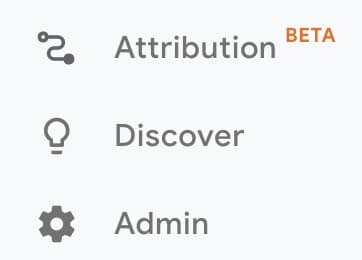
- Attribution: A new model that will help you better understand how users lead to converting on your website through multiple devices, visits or via different channels.
- Discover: Use Google Data studio to dive more into the data, or find other useful tools on offer.
- Admin: Adjust your settings to turn on or off features in your analytics platform.
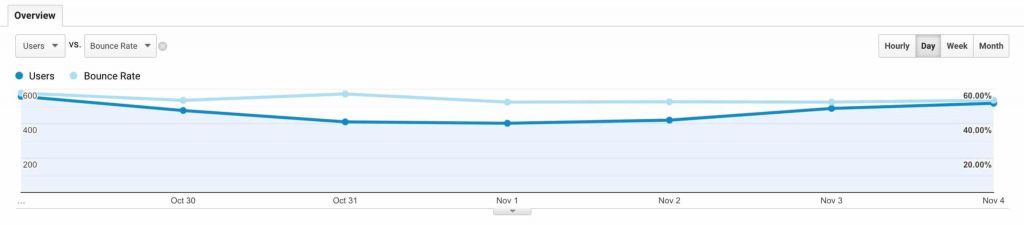
Understanding people who visit your website
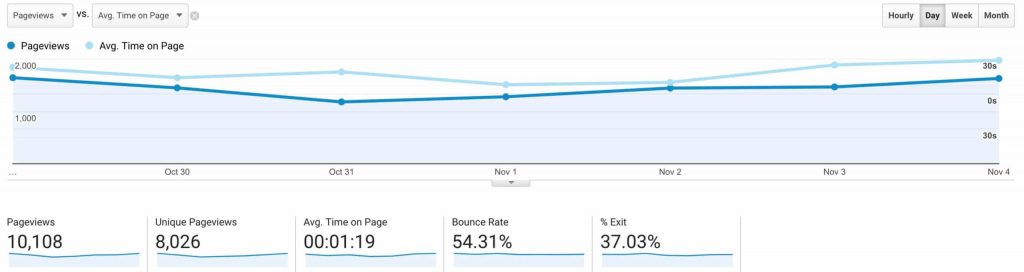
The analytics tool provides you with greater insight on who is visiting your website. For instance, you can see users (closest measurement to people) against the bounce rate, the % of those people who leave your site during the time period you have selected to review.
A high bounce rate could signal an issue on the website, for example, slow speed or poor compelling offer or written copy. Or it may be okay depending on the content or page, and what the goal of that content is. If the content is designed to inform the audience and not let them explore elsewhere, a high bounce rate may be suitable if the average time spent on the page is more than a few minutes. Again, you need to consider all the factors when painting a picture or conclusion of what the data presents you. Like a contact page that has details for an offline showroom or store. You’d expect this page to have a high bounce rate because most users will find the info they are looking for and leave.
What’s the difference between a bounce rate and exit rate?
You may also see the metric known as the exit rate and wonder what the difference is.
The bounce rate measures the percentage of single engagement sessions (a session by default is 30-minute increments spent by the user on your site).
An exit rate, however, measures the percentage of exits on a given page.
Both metrics are useful to understand your website and users further.
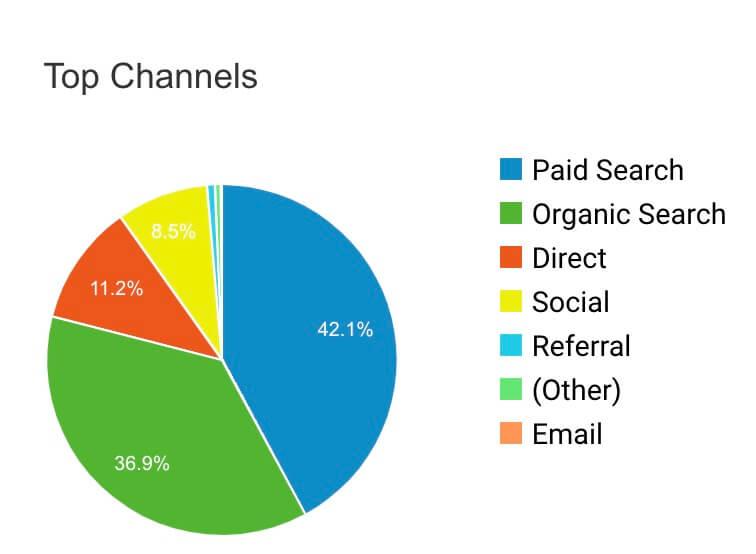
The data provided by Google Analytics also include Acquisition data, which is data about your users before they visit your website; Behaviour data, which is data about your users when they visit your website; and Conversion data, which is data about how your users convert on your website.
Acquisition data can include information on how traffic arrives at your site, the number of sessions over a period of time, the bounce rate of your visitors, and conversions for your high performing channels. You can even access the demographics of your visitors, including their gender, age, and location (make sure you turn this on in settings). User Acquisition reports are a convenient way to see how your top channels are performing and to analyse which approaches work best for bringing traffic to your site.
Behaviour data details what visitors are actually doing when they are on your website, and can include information like page views, unique page views, and average time on a page. Behaviour reports also include bounce rate (the percentage of single-page visits) and percent exit (the percentage of users who exit from a given page). The data can help you to analyse how to improve your user experience and detect which channels are not performing as well as they should.
Conversions data analyses the percentage of overall users who take a specific action when they are on your website – like making a purchase or signing up for a newsletter. This action is usually made on a dedicated landing page. Once you set up Goals for that page on your Google Analytics, reports will include how all your channels worked together to ensure your user takes the required action (i.e, conversion). The data that Google Analytics provides will help you make necessary tweaks to optimise conversions on your site.
How can I install Google Analytics on my site?
First of all, check if Google Analytics has already been installed on your site. If you don’t yet have Google Analytics correctly installed, here’s how to do it.
You will need to first install the correct tracking code to your website. This will be easy to do if you use a Content Management System (CMS) like WordPress. If you don’t have access to your CMS, you can send the code to your web developer or whoever has access to your website’s code and can install the Google Analytics tracking code for you.
If you have a CMS like WordPress that includes a built-in Google Analytics plug-in, all you’ll need to do is enter your tracking ID (found in the top right corner of the screen when you log in to Google Analytics) into the plugin for it to work. Easy!
Otherwise, you will need to find your unique tracking code and manually paste it into your website code. You can find the tracking code by logging into your Google Analytics account and clicking ‘Admin’. After selecting the appropriate Account and Property, click on ‘Tracking Info’ in the middle column labeled ‘Property’. Click on ‘Tracking Info’ and then ‘Tracking Code’ to access the tracking code. You’ll see a box with multiple lines of code, which you need to copy in it’s entirety. This is the code that you will need to insert into your website code, for every page.
Don’t panic – you won’t have to manually add it to every single page! You only need to add the code to every page template. So if you only have one page type on your page, you only need to add it to that module. If you have more than one template, make sure you include the code for each one. The code has to be pasted immediately before the </head> tag that appears on each page template you want to track. In WordPress this code can be found in the header.php file. If you can’t find this in your WordPress backend (Appearance > Editor) your web developer may have hid the file in the backend. If you are not familiar with a cPanel or file manager, get in contact with them or our WordPress team for help.
Google Analytics should now be able to track your website! If, after 24 hours, you notice that Google Analytics still has not populated data for your site, make sure you check that you installed it correctly. You can check on the status of your installation by going back to the Tracking Code section of Google Analytics. You will be able to see the Tracking Status Information at the top of page, which should say ‘Tracking Installed’. If it says ‘Waiting For Data’, you will need to check again in a few hours. However, if it says ‘Tracking Not Installed’ or ‘Not Verified’, you need to troubleshoot the problem to ensure your Google Analytics code was properly installed.
How to set up goals in Google Analytics
If you want to track conversions, you will need to set up goals and conversions for your website in addition to the basic tracking code.
To set up a goal, go to ‘Admin’ and select ‘Goals’.
Then select ‘New Goal’.
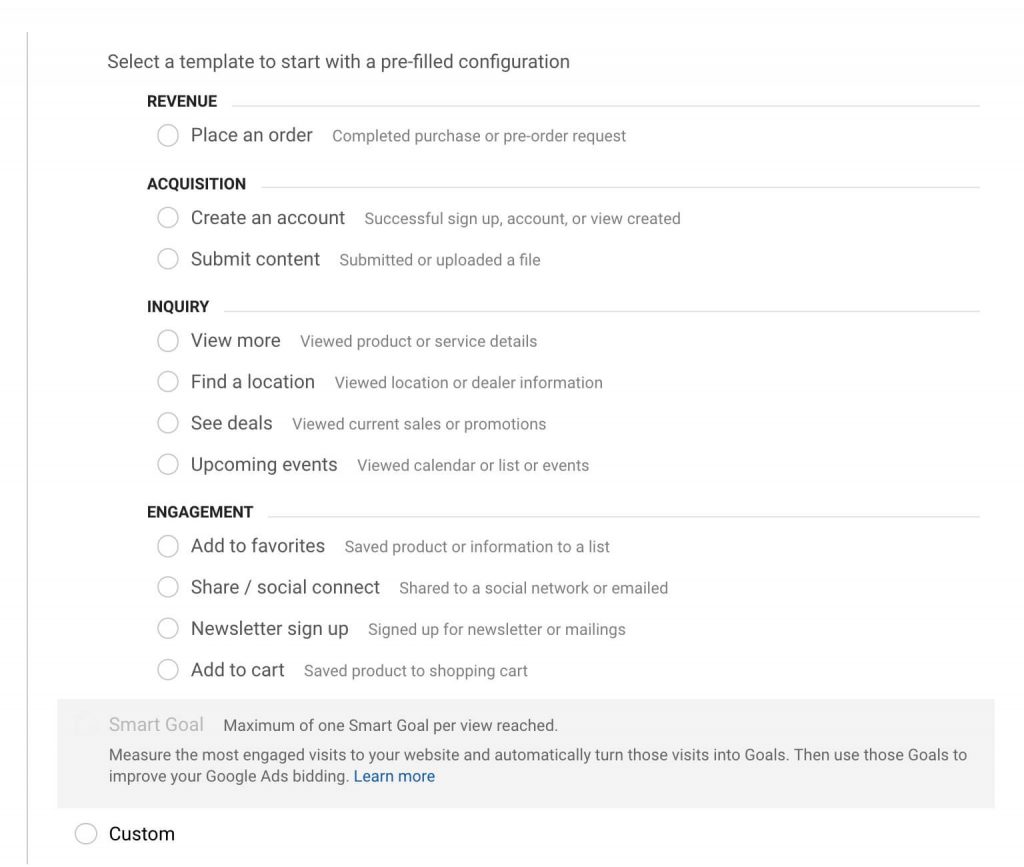
When setting up a goal, Google Analytics will give you some template options. If you are not sure or can’t find a suitable option, select ‘Custom’.
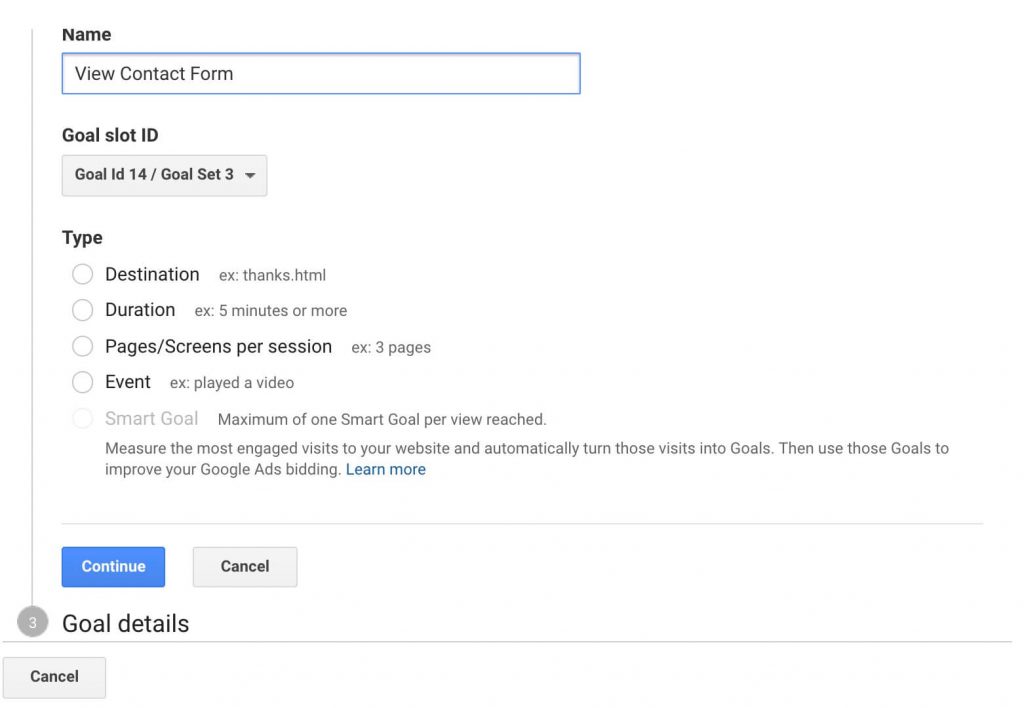
To set up the goal, you have a few options.
- Destination: you define a page e.g. contact form view would be contact form page address.
- Duration: based on how much time a visit spends e.g. a goal to track how engaged people are with your content.
- Pages/screens per session: how many pages and visits does a user make per session. Can signal engagement in addition to duration.
- Event: custom code added to the site to signal an action e.g. clicked a specific button on the page.
- Smart goal: This is used for Google Ads and helps to send most engaged users to use an audience for paid advertising.
In the example below, we would select ‘Destination’ if the page is already existing.
In this scenario, we would use the contact form page but not the full website address, just the end. Note, if your URL ends with /, it is likely you’ll need to use this too.
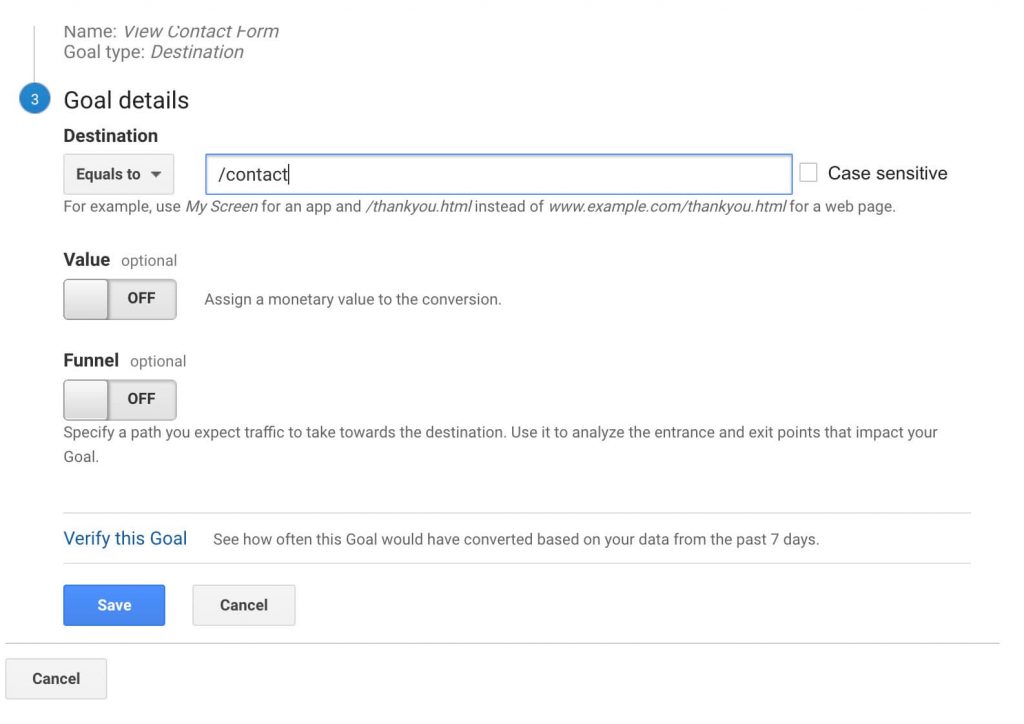
If we knew the value of the action, we could assign this also. For example, if this is an appointment form for a given service, you could assign your average customer revenue figure to this action. Although, you may want to define the value on contact form submits only. You could measure this by adding custom event code to your website when a submit is triggered or add the thank you page the form redirects to as a separate goal.
Tip: If adding a redirection page as a goal and you have different forms across your site, ensure you set up different thank you pages. Personalise the pages based on the form too for a better user experience.
The funnel option allows you to track previous page steps. You define what other pages a person may visit prior to getting to this action. It will help you to analyse how these other pages are performing to lead to that end goal or not.
Finally, before pressing save, make sure you click ‘Verify this goal’ if your tracking was set up in prior days. If you select an existing contact form page, Google will be able to verify how many people had visited the page prior. However, if you have added new details e.g. added a new event code/new page to help with your tracking, then there will be no data for Google to verify this goal. The verification helps to understand if you have set up the goal correctly or not. You can go back and do this again later if you want to check another time or review your goals data in ‘Conversions’.
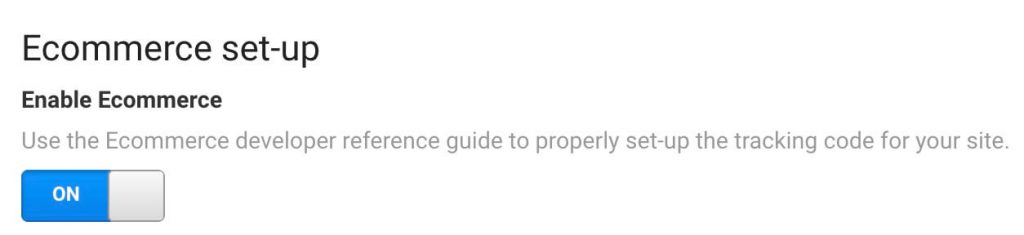
How to add eCommerce tracking
The first step is to enable eCommerce tracking in your Google Analytics admin settings. To do this go to ‘Admin’ then ‘Ecommerce settings’ and switch ‘ON’ the eCommerce option.
The good news is this is a lot easier to add if you have a WordPress or Shopify website.
For Shopify, see instructions here. For WordPress, you can use a plugin to help you.
For all other platforms see Google’s eCommerce tracking guide.
Note, eCommerce tracking is ideal for online stores. An online store should still aim to set up goals as well as eCommerce actions, especially if you have a contact form.
Need help with your data or setup?
Do you need more information on Google Analytics? Get in touch with us to discuss it further!