

Top tips for Google Analytics
Google Analytics is an accessible and powerful tool. It collects important data about your web users that you can use to improve your website.
We recently explored the benefits of Google Analytics and the key data that it provides about your website.
However, we understand that it can get slightly overwhelming when all that important data starts trickling in!
So here are 8 best practice tips for you to be able to get the most out of Google Analytics.

Start with an objective
For the sake of efficiency, it’s vital that you know what you want to achieve with your website so that you can effectively use Google Analytics to reach that objective.
Keep in mind that your objectives will be unique to your website and your business – not every crumb of data is relevant to you, so you need to identify what type of data actually matters for your website in particular.
Take the time to jot down the key objectives of your website, and then determine what data you need to keep an eye on.
For example, if your website’s key objective is to convert leads and achieve a sales target, then you need to focus on sales goals.
This can then be broken down into smaller goals, which each have specific metrics that can directly identify the data most relevant to a specific goal – ‘Goal Rate’ for sales conversion rates, ‘Completed Goals’ for a number of purchases, and ‘E-commerce: Revenue’ for revenue.
Do your research
If you want to make sure your website performs well, it’s important that it contains only the most relevant and high-performing content. Researching the type of content that does well in your industry can go a long way in creating content that appeals to your website users.
There are several ways to find out what resonates with your audience. One way is to look at what your competitors are doing – what kind of content does well on their social media platforms? Are there blog posts that have heaps of comments? Take note of the type of content that is popular with your audience, and utilise this as a topical guide for your content creation.
Another resource is BuzzSumo, where you can search any keyword or phrase and find results for the most shared content relevant to your search terms.
Search for content using a few different keywords relevant to your business, and use those search results as a guide when creating content. It’s likely that the topics that have done well in the past will also perform well for your website.
To create more timely content, you can utilise Google Trends. As the name suggests, this Google tool keeps track of trending topics from specific locations and time frames.
Creating content around key trending topics in your industry is a great way to stay relevant and ahead of the curve with your website content.
Make sure you have full access
Melinda Samson at Click Winning Content shared with us a common Google Analytics mistake is that the Business Owner or Website Owner doesn’t have full access to their Google Analytics account.
Full access means that the ‘manage users’ and ‘edit’ boxes are ticked in the User Management page. Without this, you aren’t able to add or delete other people’s access or make updates like adding Goals and Filters.
If you lose contact with the person who does have full access, this can cause issues down the track.
Create a custom dashboard
One of Google Analytics’ most useful tools is custom dashboards which you can create to conveniently access the most relevant data.
Take the time to create a few dashboards that focus on your website’s particular objectives, bearing in mind that although you can create up to 20 dashboards, having too many will defeat the purpose of being able to see your data at a quick glance.
If the thought of creating your own dashboard from scratch seems too daunting, Google Analytics offers a Solutions Gallery that contains crowd-sourced dashboard templates that are free and ready-to-use.
When you find an appropriate template for your purposes, you can easily import that template by clicking ‘Import’, selecting a view from your Google Analytics Account, and then clicking ‘Create’.
You will then be able to see your chosen dashboard template populated with your data. The template will remain on your dashboard for as long as you keep it there, and can be an incredibly convenient way to provide insight into how your website is performing with regards to your key metrics.
Rely on more than just Google Analytics
When it comes to gathering data for your website, Google Analytics is an excellent tool and one that is extremely popular too. However, it is important to remember that it isn’t the only tool available to you.
In order to get a more accurate picture of your website performance, it is a good idea for you to utilise other tools and compare the data across different applications.
For example, Google Analytics will measure differently to social media tools like Facebook. If you are running an advertising campaign, you may find that even when using the Facebook Pixel, Facebook can inflate results compared to Google Analytics.
Reviewing both Facebook and Google Analytics can help you paint a picture of what’s happening with your audience.
For example, when they visit your website, Facebook may say that one ad is performing higher than the other. However, to your surprise, the other ad may actually be the one delivering greater time on page and conversions for your goals. So, in this scenario, you may alter your Facebook campaign to get the best return on your investment.
Another example would be to use a heatmap or website visitor recordings like Hotjar to determine how people explore and visit your website.
Google Analytics provides heaps of data around what pages people visit. Moreover, these heatmaps can give you greater intel into how users view your website.
Screen recordings are also great to identify potential mishaps that may happen in an experience. For example, a button that doesn’t click anywhere or a menu that confuses your visitor leading them to pause and scroll elsewhere.
So while Google Analytics can still be your main source of data, make sure it isn’t your only source of data.
Filter out inaccuracies
When building and maintaining a website, there will be multiple people on your team that will frequently visit your website. If you don’t exclude this traffic from your analysis, you’ll essentially be receiving inaccurate data about your website usage.
You can configure Google Analytics to exclude traffic from specific IPs, such as your office IPs, your web developer’s IPs, and even your home IPs so that only traffic that is relevant gets recorded. This way, only genuine traffic gets included in your data analytics.
Act using data
When you analyse the insights that Google Analytics provides, you can try to make an educated guess about why your visitors are taking certain actions on your website. The next step is to test your hypothesis by experimenting.
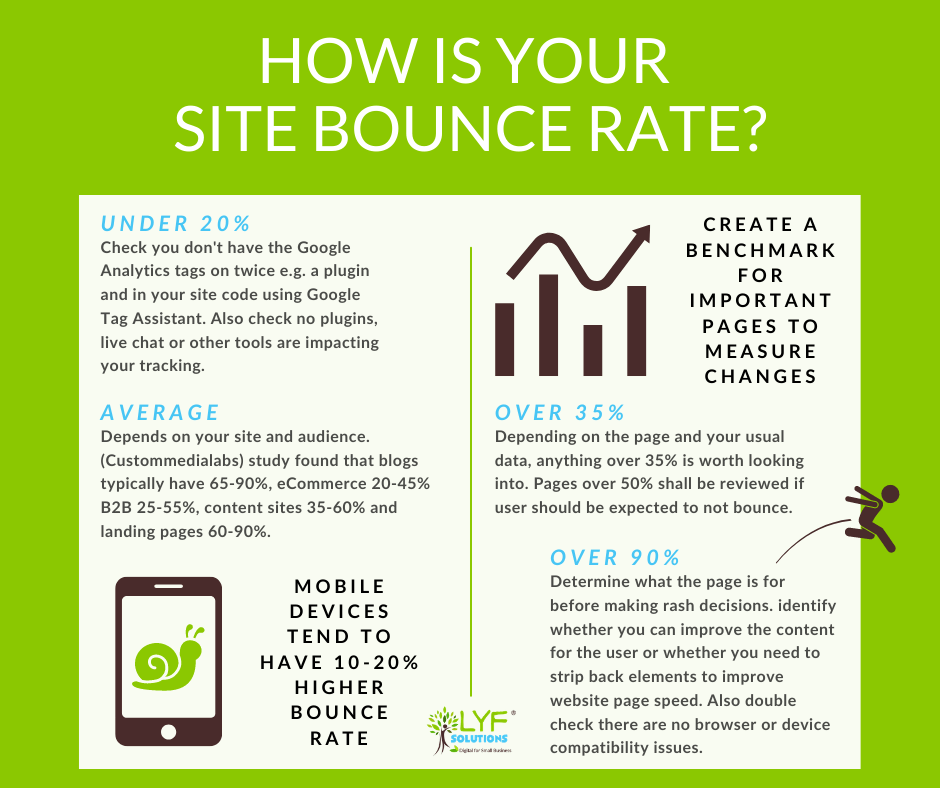
For example, you may have noticed that there is a really high bounce rate on a specific page. There are many reasons for a high bounce rate, but perhaps you’ve noticed that this page is actually really slow to load, and this is what is causing visitors to leave your website after having just visited that one page.
To test that hypothesis, you could take steps to improve that page’s performance. Maybe you compress the images, and reduce the number of ads on that page. If you notice that the bounce rate begins to decrease, great! However, if nothing changes, you can experiment even more. For example, maybe the copy needs to be improved, or you need to include a call to action.
The key thing here is to constantly use data to drive improvements to your website, one metric at a time.
Track your steps
Every time you create a specific goal for your website, make sure to add attribution links or campaign IDs to track all your activities that are directly related to that goal. This is to ensure that you can track just how useful your activities are in meeting goals. Plus it helps measure data that is directly impacted by your actions.
After all, if you don’t measure your activities, how can you prove they’re valuable?
You can use Google’s free campaign URL builder here to help. Below is an example of how you can use this.
Say, for example, that you create a series of posts on your Facebook Page to promote your latest product launch. You can create a unique link attribution on your Google Analytics. This helps to analyse how many visitors are coming from each Facebook Post.
After which, you can create more posts similar to the ones that drive the most traffic to your site.
Way too often we see that the tracking gets broken. For example, if the code was accidentally removed or the code wasn’t added to a new version of the website. You can set up an alert to be notified if this happens so that you can find out pretty quickly if there’s a tracking issue.
Make Google Analytics work for you
At the end of the day, Google Analytics is a powerful tool that can really help you understand your audience. Moreover, it helps to improve your website performance too. You must employ best practices, so you won’t miss out on important data. As a result, this helps you realise your website’s full potential.
These tips can give you a real head start in making Google Analytics work for you, but if you need more help in understanding it all, please contact us anytime with your questions. We’re happy to help!