


What metrics matter in Google Analytics?
As one of the most popular website analytics tools on the web, Google Analytics is an incredibly powerful way to track data about your website. It’s also free!
However, Google Analytics can be pretty confusing if you don’t actually know what you’re supposed to be tracking. While all the data may seem important in its own way, the truth is that most of us are time-poor, and need to focus our time on only the data that is useful for our decision making.
In the past, we’ve explained how Google Analytics can help you to improve your website, and how to utilise Google Analytics to grow your business. Today, we’d like to share the 6 Google Analytics metrics that matter. Use this cheat sheet as a guideline for focusing on the types of data that can make the biggest difference to your website’s success.
Source
Where to find it: Acquisition > Overview
This is one of many metrics that can help a website. It allows you to review where your website traffic is coming from. There are several traffic channels that Google Analytics uses to track website traffic, including:
- Organic Search – Visitors who come to your website after searching via search engines, including Google, Bing etc.
- Paid Search – Visitors who come to your website via paid ads
- Direct – Visitors who come to your website without a referral source that can’t be tracked. This could include typing your website URL, clicking on a browser bookmark or dark social sharing
- Referral – Visitors who come to your website by clicking on a link on another website
- Social – Visitors who come to your website from a known social media platform like Facebook
- Other – Visitors who come to your website using your own custom campaign tracking using UTM parameters incorrectly e.g. medium is Instagram instead of social.
Knowing how you are acquiring your website traffic can help you to understand what’s working to drive people to your website and what’s not. For example, identifying which sources are sending you the most traffic can indicate that you need to focus your marketing campaigns on those traffic channels, over those which may be providing less. You can dig deeper on this by looking at what channels contribute to the most goal completions or conversions.
Audience
Where to find it: Audience > Overview
While knowing where your audience comes from is important, knowing who they are is just as (if not more!) important. The Audience metric on Google Analytics lists many details about your website visitors, but here are the few metrics that really matter:
- Demographics – This includes age, gender, and interests
- Location – This includes the city and country they are visiting from
- Behaviour – This can show whether or not they are new VS returning visitors
- Devices – This lists the devices on which your visitors are viewing your website
- Sessions – This is the number of times someone views your pages. It is defined usually by the user spending up to 30 minutes on your website. If they return after this timeframe, it’s counted as another session.
- Users – This is the number of people who visit your site. It is defined by a cookie that can last between 6 months to 2 years, unless deleted by the user
- Page views – The number of pages viewed by a user, including those that are looked at more than once
Identifying who your audience is – and how they behave – can help you improve your website based on your audience’s preferences. For example, if you notice that most of your website visitors are interacting with your website using a mobile device, it might make sense to optimise your website for mobile viewing.
Bounce rate
Where to find it: Audience > Overview
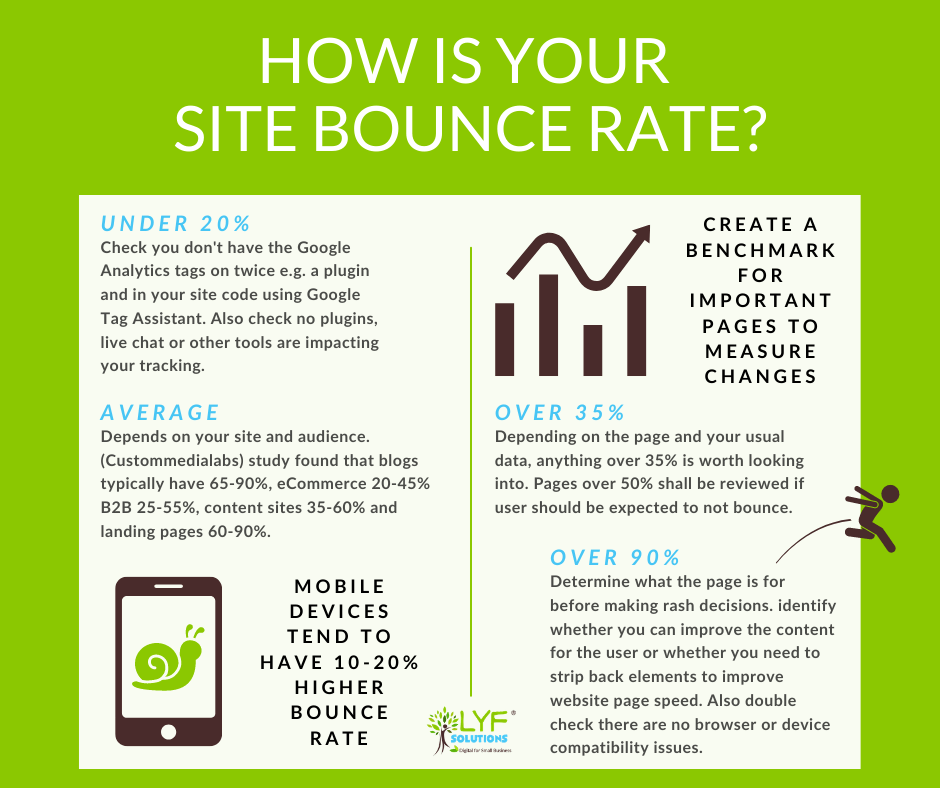
Your website’s bounce rate is the percentage of sessions where a user leaves your website after visiting just a single page. Ideally, you want your website bounce rate to be low, but this actually depends on what page you are tracking.
For example, if the web page in question contains your business address and a map to your location, then it makes sense that the user leaves your site, as they’ve already found the information they needed. In this case, a high bounce rate indicates that the web page is performing exactly as intended!
On the other hand, if the web page in question is meant to encourage the user to further interact with your website (like a list of blog posts, for example), then a high bounce rate is an indicator that the page is under-performing and needs to be adjusted accordingly. In the example of the blog posts, this can mean adding better photos, infographics, valuable content, or creating more intriguing headlines.
In general, a bounce rate of 40-50% is seen as average. That being said, it’s important to figure out a percentage that makes sense based on what is important for your website in particular, and as illustrated in the examples we’ve given, what a web page’s function is. Also, note that bounce rates tend to be 10-20% higher on mobile devices!
For a breakdown of bounce rate by page go to Behaviour > Site Content > All pages.
Exit rate
Where to find it: Behaviour > Content > Exit Pages
A web page’s exit rate indicates the percentage of users that visited that web page before leaving your website completely. Essentially, these are the pages on your website that your visitors are viewing last.
It’s important to track which pages on your site are getting the highest exit rates, particularly if you have an e-commerce website (because this could mean you’re losing potential sales!). You can use this information by checking if there are specific things on those pages that are prompting your website visitors to leave. You can then look to optimise those web pages to decrease the exit rates.
Behaviour Flow
Where to find it: Behaviour > Behaviour Flow
This metric allows you to see how your audience interacts with your website on each visit. It visualises the path that a user follows from one page to the next. You can also click onto individual pages and sort by acquisition type.
You can view your users’ Behaviour Flow by content grouping too. This is a great way to view your users’ behaviours based on the different topics or categories on your website. For example, men and women’s wear, or jackets and dresses.
Viewing your users’ Behaviour Flow by events, which can include searching for an item, viewing an item, adding items to a cart, and moving to checkout. As you can see, viewing the Behaviour Flow this way can “chart” the path your users are taking in the process of conversion for a product or service you are offering.
Behaviour Flow reports can help you figure out the content that resonates most with your audience, and also identify problem areas where you might be losing your audiences’ interest.
Average Session Duration
Where to find it: Behaviour > Overview
This metric shows the average amount of time users spend on a single web page on your website, keeping in mind that users can have multiple sessions on a particular page. As we mentioned before, a session is usually each half-hour that a user spends on your website.
It’s important to aim for a higher duration because this metric is an indicator of the quality of your content. In general, if a user finds your content engaging, they will want to spend more time on your website (and vice versa). This is particularly important if your website contains content like blog posts and articles.
There are many ways you can encourage users to spend more time on a web page (and your website in general). Optimising your content using a content creation strategy is a great first step in identifying the types of content that will engage your audience and keep them interested.
Get the most out of Google Analytics
Google Analytics is a very useful and powerful tool. However, some data is more important than others when it comes to your website’s performance. We hope that you’ll be better able to utilise Google Analytics now that you know these 6 metrics that actually matter.
If you are still finding it all a little unclear, please get in touch with us – we’d be happy to make it clearer for you!